
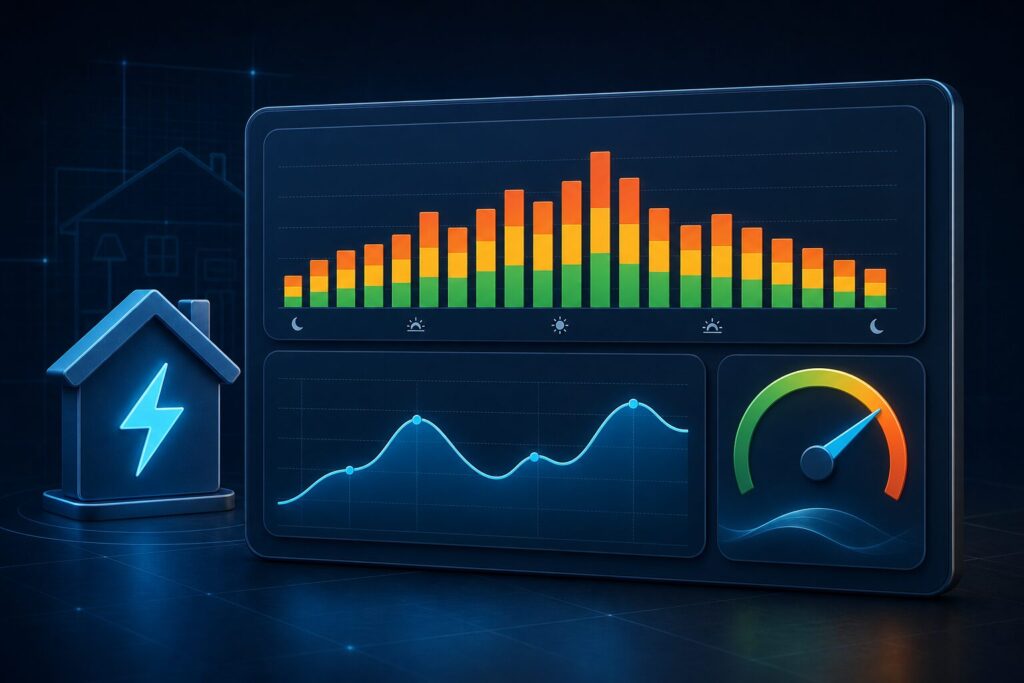

Updated in August 2026. eData provides several ways to visualize official Datadis electricity readings in Home Assistant. You can use its native card, the Energy dashboard, or advanced ApexCharts configurations.
Regional requirement: these charts use eData readings obtained through Datadis and therefore require an electricity supply point in Spain. Home Assistant and ApexCharts are available worldwide, but the official data-source integration depends on the country and electricity provider.
Quick recommendation: start with the native
edata-card. Use ApexCharts only when you need a layout or combination of series that the included card does not provide.
This guide assumes that eData is already installed and has downloaded some data. If it is not, start with Datadis and eData in Home Assistant: the complete guide.
Before creating a chart
- Find the main entity, normally
sensor.edata_xxxx. - Replace
xxxxwith the final characters shown in your entity ID. - Confirm that eData has downloaded at least one registered day.
- Remember that Datadis does not provide real-time readings.
Do not copy the identifier from another installation. Find yours under Settings → Devices & services → eData or Developer tools → States.
Option 1: the native eData card
eData installs and registers edata-card automatically. You do not need to add a Lovelace resource URL manually.
Add it with the visual editor
- Open the dashboard you want to edit.
- Select Edit dashboard → Add card.
- Search for eData.
- Select the main entity.
- Choose the chart, aggregation period, and number of records.
Daily consumption for the last 30 days
type: custom:edata-card
entity: sensor.edata_xxxx
chart: consumptions
aggr: day
records: 30
title: Daily consumption
The card automatically separates P1, P2, and P3 when those tariff periods are present in the data.
Latest registered day
type: custom:edata-card
entity: sensor.edata_xxxx
chart: summary-last-day
title: Latest registered day
Current month
type: custom:edata-card
entity: sensor.edata_xxxx
chart: summary-month
title: Current month
Previous month
type: custom:edata-card
entity: sensor.edata_xxxx
chart: summary-last-month
title: Previous month
Maximum demand
type: custom:edata-card
entity: sensor.edata_xxxx
chart: maximeter
title: Maximum registered power
Exported energy and costs
If your supply includes generation, or if compatible tariff calculation is enabled, set chart to surplus or costs. Cost charts are only meaningful when the configured formulas and prices match the electricity contract.
Custom colors
type: custom:edata-card
entity: sensor.edata_xxxx
chart: consumptions
aggr: day
records: 30
title: Consumption by tariff period
colors:
  - '#e54304'
  - '#ff9e22'
  - '#9ccc65'
Available aggregation periods
aggr value | Recommended use |
|---|---|
hour | Hourly detail for one or two days |
day | Compare recent days |
week | Weekly trends |
month | Compare months |
year | Multi-year overview |
The records option controls how many data points the card requests. Asking for hundreds of points unnecessarily makes dashboards heavier, particularly on mobile devices.
Option 2: the Home Assistant Energy dashboard
The Energy dashboard is the best choice for a long-term overview. eData publishes statistics that Home Assistant can use directly.
- Open Settings → Dashboards → Energy.
- Under grid consumption, select Add consumption.
- Choose the eData statistic for total consumption.
- Configure returned-to-grid energy separately if solar generation is available.
- Save and allow Home Assistant to process the statistics.
The main statistic normally has an internal ID similar to edata:xxxx_consumption. It is not a regular sensor, so it can be offered by the Energy dashboard even when it is not visible as a standalone entity.
Option 3: advanced ApexCharts visualizations
ApexCharts Card offers detailed control of series, axes, and layout. eData exposes historical readings through WebSockets so the card can request daily, monthly, or hourly points.
Install ApexCharts Card
- Open HACS → Frontend.
- Find ApexCharts Card.
- Install it.
- Perform a full browser refresh or restart the mobile app.
Daily consumption stacked by tariff period
Replace every occurrence of xxxx with the characters from your main entity:
type: custom:apexcharts-card
graph_span: 30d
span:
  end: day
  offset: '-1d'
header:
  show: true
  title: Daily consumption by tariff period
  show_states: false
all_series_config:
  type: column
  unit: kWh
  stack_group: tariffs
  show:
    legend_value: false
series:
  - entity: sensor.edata_xxxx
    name: Peak
    color: '#e54304'
    data_generator: |
      return hass.connection.sendMessagePromise({
        type: 'edata/ws/consumptions',
        scups: 'xxxx',
        aggr: 'day',
        tariff: 'p1',
        records: 30
      });
  - entity: sensor.edata_xxxx
    name: Flat
    color: '#ff9e22'
    data_generator: |
      return hass.connection.sendMessagePromise({
        type: 'edata/ws/consumptions',
        scups: 'xxxx',
        aggr: 'day',
        tariff: 'p2',
        records: 30
      });
  - entity: sensor.edata_xxxx
    name: Valley
    color: '#9ccc65'
    data_generator: |
      return hass.connection.sendMessagePromise({
        type: 'edata/ws/consumptions',
        scups: 'xxxx',
        aggr: 'day',
        tariff: 'p3',
        records: 30
      });
The entity acts as the Lovelace update reference. Chart points are returned directly by the eData WebSocket.
Maximum demand with ApexCharts
type: custom:apexcharts-card
graph_span: 1y
header:
  show: true
  title: Maximum demand
  show_states: false
chart_type: scatter
series:
  - entity: sensor.edata_xxxx
    name: Peak
    type: column
    data_generator: |
      return hass.connection.sendMessagePromise({
        type: 'edata/ws/maximeter',
        scups: 'xxxx',
        tariff: 'p1'
      });
  - entity: sensor.edata_xxxx
    name: Flat and valley
    type: column
    data_generator: |
      return hass.connection.sendMessagePromise({
        type: 'edata/ws/maximeter',
        scups: 'xxxx',
        tariff: 'p2'
      });
WebSockets available to advanced users
| Type | Information |
|---|---|
edata/ws/consumptions | Historical consumption |
edata/ws/surplus | Historical exported energy |
edata/ws/costs | Calculated costs |
edata/ws/maximeter | Maximum-demand readings |
edata/ws/summary | Summary and available attributes |
Consumption, exported-energy, and cost endpoints accept aggr, records, and, where applicable, tariff. These endpoints are intended for advanced cards and automations; most users do not need to call them directly.
Troubleshooting
Custom element doesn’t exist: edata-card
- Confirm that eData loaded without errors.
- Restart Home Assistant after installing or updating eData.
- Perform a full browser refresh with
Ctrl + F5. - Fully close and reopen the mobile app.
- Do not add duplicate Lovelace resources manually.
The card is empty
- Verify that
sensor.edata_xxxxis your actual entity ID. - Confirm that eData has downloaded at least one day.
- Temporarily reduce the aggregation range and number of records.
- Remember that a partial day may not be available yet.
ApexCharts reports an error
Check every xxxx value, YAML indentation, and whether ApexCharts Card is installed. Do not use obsolete examples based on sensor.datadis_... entities: eData uses its main entity and the WebSockets documented above.
Which option should you use?
| Requirement | Recommended option |
|---|---|
| Fast and maintainable setup | Native eData card |
| Annual overview and energy flows | Energy dashboard |
| Fully customized design | ApexCharts Card |
| Combine official data with other sensors | ApexCharts or a purpose-built card |
A practical setup is to use the Energy dashboard for long-term history, an eData card for quick checks, and ApexCharts only where its extra flexibility provides useful information.
All supported options and recent changes are documented in the eData repository.