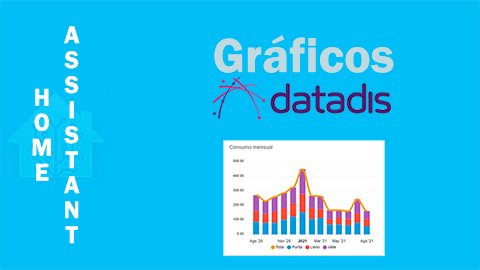
Tarjeta ApexCharts
Esta tarjeta nos permitirá crear los gráficos de Datadis, pero también gráficos de otras entidades en nuestro Home Assistant. Vamos a ver cómo instalarla. Para que esta tarjeta nos muestre los gráficos de nuestro consumo eléctrico, previamente tenemos que haber hecho la integración de Datadis en Home Assistant.
Instalación
HACS (recomendado)
Esta tarjeta está disponible en HACS (Home Assistant Community Store). HACS es una tienda comunitaria de terceros y no está incluida en Home Assistant lista para usar. Simplemente entre en HACS, Interfaz y busque por «apexcharts»
Instalación manual
Descargue y copie apexcharts-card.js desde la última versión a su directorio config/www.
Agregue la referencia del recurso como se describe a continuación.
Agregar referencia de recurso
Si configura Lovelace a través de YAML, agregue una referencia apexcharts-card.js dentro de su configuration.yaml:
resources:
  - url: /local/apexcharts-card.js?v=1.10.0
    type: module
De lo contrario, si prefiere el editor gráfico, use el menú para agregar el recurso:
- Asegúrese de que el modo avanzado esté habilitado en su perfil de usuario (haga clic en su nombre de usuario para llegar allí)
- Vaya a Configuración -> Paneles Lovelace -> Pestaña Recursos. Pulsa el icono naranja (+)
- Ingrese la URL
/local/apexcharts-card.jsy seleccione el tipo «Módulo JavaScript». - Reinicie Home Assistant.
A continuación se ofrecen una serie de tarjetas (en yaml) que permiten visualizar los datos obtenidos mediante gráficas interactivas generadas con un componente llamado apexcharts-card, que también debe instalarse manualmente o mediante HACS. Siga las instrucciones de https://github.com/RomRider/apexcharts-card y recuerde tener el repositorio a mano para personalizar las gráficas a continuación.
NOTA: en las siguientes tarjetas deberá reemplazar TODAS xxxx por los últimos cuatro caracteres de su CUPS.
Consumo diario
type: custom:apexcharts-card
graph_span: 30d
stacked: true
span:
  offset: '-1d'
experimental:
  brush: true
header:
  show: true
  title: Consumo diario
  show_states: false
  colorize_states: false
brush:
  selection_span: 10d
all_series_config:
  type: column
  unit: kWh
  show:
    legend_value: false
series:
  - entity: sensor.edata_XXXX
    name: Total
    type: column
    data_generator: |
      return hass.connection.sendMessagePromise({
      type: 'edata/consumptions/daily',
      scups: 'XXXX'}).then(
          (resp) => {
              return resp.map((data, index) => {
                return [new Date(data['datetime']).getTime(), data['value_kWh']];
              });
          }
      );
    show:
      in_chart: false
      in_brush: true
  - entity: sensor.edata_XXXX
    name: Punta
    data_generator: |
      return hass.connection.sendMessagePromise({
      type: 'edata/consumptions/daily',
      scups: 'XXXX'}).then(
          (resp) => {
              return resp.map((data, index) => {
                return [new Date(data['datetime']).getTime(), data['value_p1_kWh']];
              });
          }
      );
  - entity: sensor.edata_XXXX
    name: Llano
    data_generator: |
      return hass.connection.sendMessagePromise({
      type: 'edata/consumptions/daily',
      scups: 'XXXX'}).then(
          (resp) => {
              return resp.map((data, index) => {
                return [new Date(data['datetime']).getTime(), data['value_p2_kWh']];
              });
          }
      );
  - entity: sensor.edata_XXXX
    name: Valle
    data_generator: |
      return hass.connection.sendMessagePromise({
      type: 'edata/consumptions/daily',
      scups: 'XXXX'}).then(
          (resp) => {
              return resp.map((data, index) => {
                return [new Date(data['datetime']).getTime(), data['value_p3_kWh']];
              });
          }
      );
Consumo mensual
type: custom:apexcharts-card
graph_span: 395d
stacked: true
yaxis:
  - id: eje
    opposite: false
    max: '|+20|'
    min: ~0
    apex_config:
      forceNiceScale: true
header:
  show: true
  title: Consumo mensual
  show_states: false
  colorize_states: false
all_series_config:
  type: column
  unit: kWh
  yaxis_id: eje
  extend_to_end: false
  show:
    legend_value: false
series:
  - entity: sensor.edata_XXXX
    type: line
    name: Total
    data_generator: |
      return hass.connection.sendMessagePromise({
      type: 'edata/consumptions/monthly',
      scups: 'XXXX'}).then(
          (resp) => {
              return resp.map((data, index) => {
                return [new Date(data['datetime']).getTime(), data['value_kWh']];
              });
          }
      );
    show:
      in_chart: true
  - entity: sensor.edata_XXXX
    name: Punta
    data_generator: |
      return hass.connection.sendMessagePromise({
      type: 'edata/consumptions/monthly',
      scups: 'XXXX'}).then(
          (resp) => {
              return resp.map((data, index) => {
                return [new Date(data['datetime']).getTime(), data['value_p1_kWh']];
              });
          }
      );
  - entity: sensor.edata_XXXX
    name: Llano
    data_generator: |
      return hass.connection.sendMessagePromise({
      type: 'edata/consumptions/monthly',
      scups: 'XXXX'}).then(
          (resp) => {
              return resp.map((data, index) => {
                return [new Date(data['datetime']).getTime(), data['value_p2_kWh']];
              });
          }
      );
  - entity: sensor.edata_XXXX
    name: Valle
    data_generator: |
      return hass.connection.sendMessagePromise({
      type: 'edata/consumptions/monthly',
      scups: 'XXXX'}).then(
          (resp) => {
              return resp.map((data, index) => {
                return [new Date(data['datetime']).getTime(), data['value_p3_kWh']];
              });
          }
      );
Maxímetro
type: custom:apexcharts-card
graph_span: 1y
span:
  offset: '-30d'
header:
  show: true
  title: Maxímetro
  show_states: false
  colorize_states: false
chart_type: scatter
series:
  - entity: sensor.edata_XXXX
    name: Potencia máxima
    type: column
    extend_to_end: false
    unit: kW
    show:
      extremas: true
      datalabels: false
    data_generator: |
      return hass.connection.sendMessagePromise({
      type: 'edata/maximeter',
      scups: 'XXXX'}).then(
          (resp) => {
              return resp.map((data, index) => {
                return [new Date(data['datetime']).getTime(), data['value_kW']];
              });
          }
      );
Ayer
type: custom:apexcharts-card
chart_type: pie
header:
  show: true
  title: Ayer
  show_states: true
  colorize_states: true
  floating: true
all_series_config:
  unit: kWh
  show:
    legend_value: true
    in_header: false
apex_config:
  chart:
    height: 250px
series:
  - entity: sensor.edata_XXXX
    attribute: yesterday_kWh
    show:
      in_chart: false
      in_header: true
    name: Total
  - entity: sensor.edata_XXXX
    attribute: yesterday_p1_kWh
    name: Punta
  - entity: sensor.edata_XXXX
    attribute: yesterday_p2_kWh
    name: Llano
  - entity: sensor.edata_XXXX
    attribute: yesterday_p3_kWh
    name: Valle
Mes en curso
type: custom:apexcharts-card
chart_type: pie
header:
  show: true
  title: Mes en curso
  show_states: true
  colorize_states: true
  floating: true
all_series_config:
  show:
    legend_value: true
    in_header: false
  unit: kWh
apex_config:
  chart:
    height: 250px
series:
  - entity: sensor.edata_XXXX
    attribute: month_kWh
    show:
      in_chart: false
      in_header: true
    name: Total
  - entity: sensor.edata_XXXX
    attribute: month_p1_kWh
    name: Punta
  - entity: sensor.edata_XXXX
    attribute: month_p2_kWh
    name: Llano
  - entity: sensor.edata_XXXX
    attribute: month_p3_kWh
    name: Valle
  - entity: sensor.edata_XXXX
    unit: €
    attribute: month_pvpc_€
    show:
      in_chart: false
      in_header: true
    name: PVPC
Mes anterior
type: custom:apexcharts-card
chart_type: pie
header:
  show: true
  title: Mes pasado
  show_states: true
  colorize_states: true
  floating: true
all_series_config:
  show:
    legend_value: true
    in_header: false
  unit: kWh
apex_config:
  chart:
    height: 250px
series:
  - entity: sensor.edata_XXXX
    attribute: last_month_kWh
    show:
      in_chart: false
      in_header: true
    name: Total
  - entity: sensor.edata_XXXX
    attribute: last_month_p1_kWh
    name: Punta
  - entity: sensor.edata_XXXX
    attribute: last_month_p2_kWh
    name: Llano
  - entity: sensor.edata_XXXX
    attribute: last_month_p3_kWh
    name: Valle
  - entity: sensor.edata_XXXX
    unit: €
    attribute: last_month_pvpc_€
    show:
      in_chart: false
      in_header: true
    name: PVPC
Si quieres una mayor explicación, no te pierdas el vídeo de gráficos de Datadis
Sígueme a Youtube

