

Updated August 30, 2026.
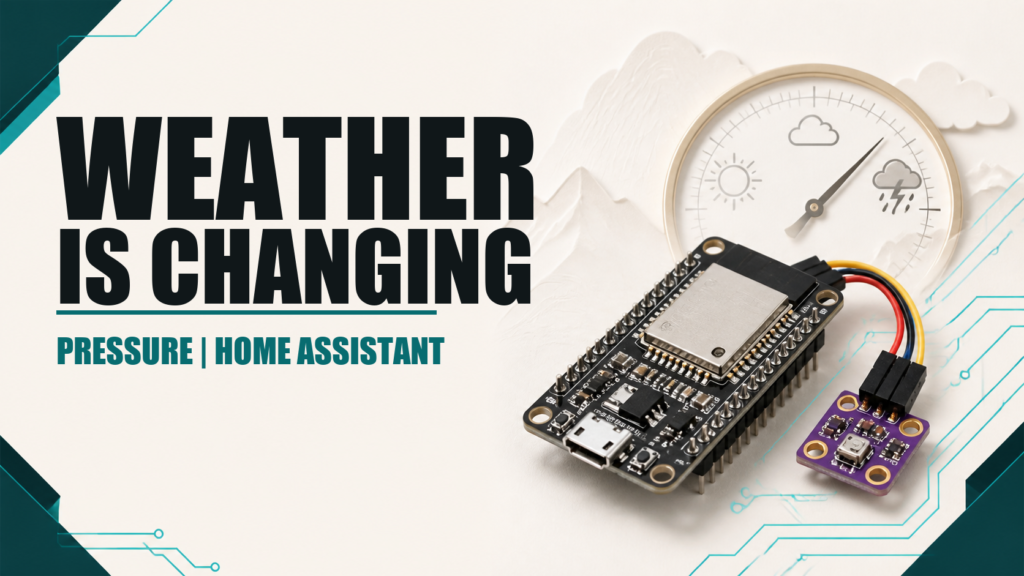
Home Assistant can turn readings from a local barometer into a weather pressure trend sensor. It does not replace a professional forecast, but it can show whether pressure is rising, falling, or stable and expose that information to dashboards and automations.
What atmospheric pressure can tell you
A sustained pressure rise is often associated with more stable weather, while a sustained fall can accompany an approaching disturbance. This is not an absolute rule. Local conditions also depend on fronts, terrain, wind, humidity, and season.
The result should therefore be described as a pressure trend, not a promise of sunshine or rain. It is most useful for studying changes at your own location and complementing a weather forecast.
Requirements
- A pressure entity in Home Assistant, such as a BME280.
- Regular, reasonably stable readings.
- Home Assistant Recorder history so the time window can be rebuilt after a restart.
- The actual pressure entity, called
sensor.bme280_pressurein these examples.
Before continuing, open Developer Tools and confirm that the entity returns a number with a consistent unit, normally hPa. If it reports absolute pressure, altitude changes the value, although the direction of change remains useful. Comparing it with weather maps requires pressure corrected to sea level.
Recommended method: change over a time window
The Statistics integration can calculate the difference between the newest and oldest samples in a window. This is clearer than comparing current pressure with a 12-hour mean, which is not the same thing as the value from 12 hours ago.
sensor:
  - platform: statistics
    name: "Pressure change over 3 hours"
    unique_id: pressure_change_3_hours
    entity_id: sensor.bme280_pressure
    state_characteristic: change
    max_age:
      hours: 3
    sampling_size: 200
    precision: 1
state_characteristic: change subtracts the oldest value in the window from the newest. A positive result means pressure is rising; a negative result means it is falling. sampling_size must be large enough to hold updates across the full three hours. With one reading per minute, 200 samples provides some margin.
If the source updates infrequently, inspect the age_coverage_ratio attribute. A nominal three-hour window containing only two recent readings does not truly represent three hours.
Create a text entity for the trend
template:
  - sensor:
      - name: "Local pressure trend"
        unique_id: local_pressure_trend
        icon: mdi:gauge
        availability: >-
          {{ states('sensor.pressure_change_over_3_hours')
             not in ['unknown', 'unavailable'] }}
        state: >-
          {% set change = states('sensor.pressure_change_over_3_hours') | float(0) %}
          {% if change >= 0.8 %}
            Rising
          {% elif change <= -0.8 %}
            Falling
          {% else %}
            Stable
          {% endif %}
        attributes:
          change_hpa_3h: >-
            {{ states('sensor.pressure_change_over_3_hours') | float(0) }}
The ±0.8 hPa threshold over three hours is a starting point, not a universal meteorological constant. Observe your data for several weeks and adjust it to local behavior and sensor noise. A threshold that is too low will flip states continuously, while one that is too high will hide gradual changes.
Alternative: the Trend helper
Home Assistant also includes the Trend helper under Settings, Devices & services, Helpers. It fits a line through multiple samples and creates a binary sensor when the slope exceeds a minimum. You can create one entity for rising pressure and another for falling pressure.
binary_sensor:
  - platform: trend
    sensors:
      pressure_rising:
        entity_id: sensor.bme280_pressure
        friendly_name: "Pressure rising"
        sample_duration: 10800
        max_samples: 200
        min_samples: 20
        min_gradient: 0.000074
      pressure_falling:
        entity_id: sensor.bme280_pressure
        friendly_name: "Pressure falling"
        sample_duration: 10800
        max_samples: 200
        min_samples: 20
        min_gradient: -0.000074
Trend expresses slope in source units per second. For an hPa entity, 0.000074 is approximately 0.8 hPa over three hours. A falling detector can use a negative slope or inversion, depending on the chosen setup. Always verify the direction against real data.
Avoid misleading results
- Do not use percentages for pressure change: work in hPa; 1% is roughly 10 hPa, which is a large change in many situations.
- Do not confuse a mean with a historical value: a 12-hour mean is not the exact pressure from 12 hours ago.
- Do not move the sensor: changing floors alters pressure.
- Watch module temperature: a warm controller can affect nearby environmental sensors.
- Do not promise rain: falling pressure is one signal, not a complete forecast.
Dashboard and automation ideas
- Show the trend beside a 24- or 48-hour pressure graph.
- Send a notification only when pressure falls and an external forecast also expects precipitation.
- Record rapid changes to study local weather events.
- Change a card icon or color without treating the trend as an alarm.
Conclusion
The clearest way to build a local weather trend is to calculate pressure change over a known window and classify it with cautious thresholds. Statistics provides an easy-to-read numeric value, while Trend is useful when you want to work with slope. In both cases, calibrate against your history and present the result as a trend rather than an infallible forecast.